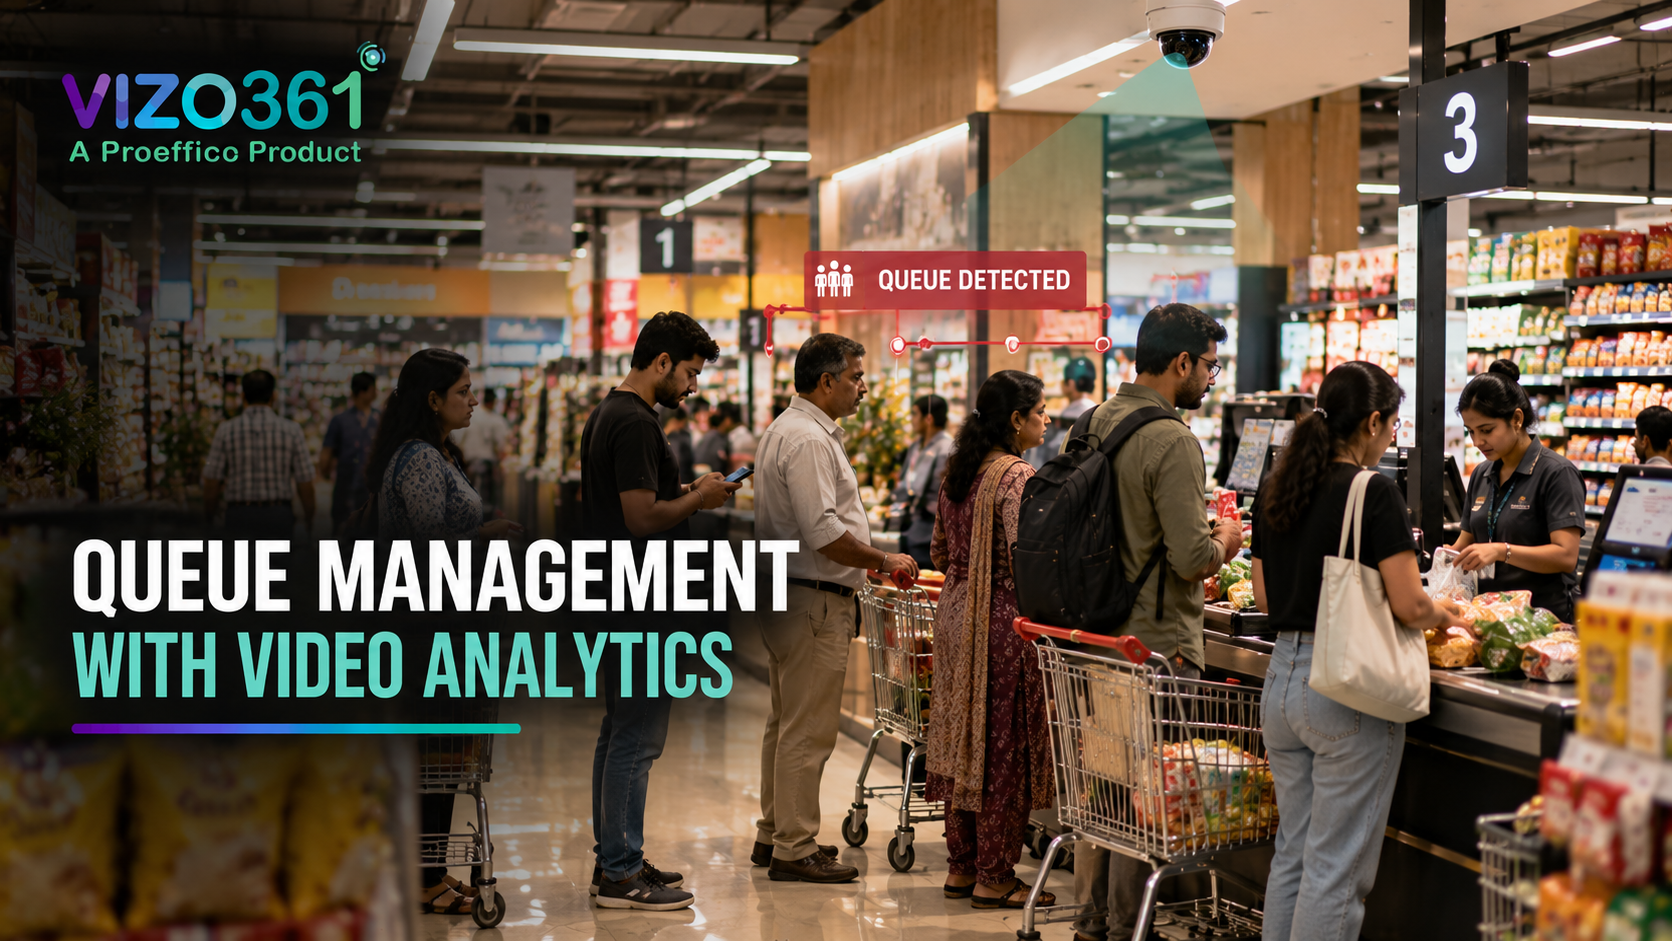
A supermarket manager doesn't need a report to know when the billing counters are backed up — the line is visible from the entrance. What's harder to know is *why* it happened, *how long* it's been building, and whether it's still worth opening a fourth counter at 7:40 pm or too late to matter. That gap between seeing a queue and acting on it, in time, is what queue management with video analytics is built to close.
What long queues actually cost
Retailers tend to treat long queues as a customer-experience problem, which it is, but it's also a revenue problem that rarely gets measured properly. A shopper who walks up to a checkout line, sees six carts ahead, and quietly leaves the basket in the aisle doesn't show up in any sales report — they just show up as a lower conversion rate that nobody can explain.
Industry research on queue abandonment consistently points to the same pattern: wait time tolerance is short, and it drops fast once a line crosses a certain length. What's consistent across formats — supermarkets, pharmacy chains, QSR counters, fuel-station convenience stores — is that the cost isn't just the lost basket. It's the shopper who doesn't come back next week because the last visit felt slow.
The frustrating part for store operations teams is that most of this is preventable. Staffing isn't usually the problem — most stores have enough people on the floor. The problem is that nobody knows a queue is forming until it's already six carts deep, because the only person watching the checkout area is whoever happens to walk past it.
How queue analytics measures wait time
Video analytics for queue management runs on the CCTV cameras already covering your checkout zone — VIZO361 doesn't require new hardware pointed at the tills. The system detects people entering and leaving a defined queue zone, counts how many are waiting at any moment, and calculates dwell time: how long each person has actually been standing in that line.
This is a meaningfully different number from "counter is busy." A counter can look busy with three people who just walked up, or it can look calm with two people who've been standing there for six minutes because the biller is mid-shift-change. Dwell time captures the second case, which is the one that actually drives complaints and walkouts.
The same underlying technology — people detection and zone-based counting on existing cameras — is what powers VIZO361's footfall and people-counting analytics , just applied to a different zone of the store. Queue management is really footfall analytics pointed at the checkout area with a wait-time clock attached.
Real-time staffing alerts
Measurement on its own doesn't reduce a line. What changes behavior is the alert that fires while there's still time to act — not a report that lands the next morning showing yesterday's queues were too long.
In practice this looks like:
- A threshold alert when queue length or average wait time crosses a set limit (say, more than 4 people or over 5 minutes waiting) at a given counter or zone.
- A notification to the floor manager's screen or phone, not just a dashboard nobody's watching.
- Store-wide visibility for multi-counter formats, so a manager can see that counter 2 is backed up while counter 5 is idle, and reassign a biller in the moment instead of after the fact.
- Escalation for sustained breaches — a 2-minute spike is normal during a rush; a 20-minute one across multiple counters usually means something else has gone wrong (a POS glitch, a missing biller, a stock issue at the counter).
This is the part that turns a monitoring tool into an operations tool. The value isn't the historical chart — it's the manager getting a nudge at 6:55 pm instead of finding out at 8 pm review that Saturday evening wait times were consistently over 8 minutes.
Metrics that matter
Not every number a queue system can produce is worth building a habit around. The ones that consistently change decisions for retail operations teams are:
- Average wait time by counter, by hour — shows which counters and time slots need more coverage, and whether that coverage is actually being provided.
- Peak queue length — the busiest moment of the day, which is usually when abandonment happens and when staffing gaps are most visible.
- Queue length vs. staff on counter — the ratio that tells you whether a long line is a demand problem (genuinely busy store) or a staffing problem (billers pulled away for stocking, breaks overlapping, a counter left unmanned).
- Time-of-day and day-of-week patterns — most stores have a predictable rhythm (lunch rush, weekend evenings, month-end salary days). Once that pattern is visible in data instead of gut feel, staffing rosters can be built around it instead of reacted to.
- Abandonment proxies — people who join a queue zone and leave before reaching the counter, which is the closest a camera-based system can get to counting a lost sale at checkout.
A useful discipline here is to resist the urge to track everything. Most store managers get real value from three or four of these, reviewed weekly, not a dashboard with twenty tiles nobody opens.
How to start
Queue management is one of the more straightforward video analytics modules to pilot, because the ROI question is simple to test: does average wait time at checkout come down over a defined period after the alerts go live.
A sensible rollout:
- Start with your busiest counters or your worst time window — peak evening hours or weekend rushes are usually where the pain (and the opportunity) is concentrated. Don't try to instrument every till on day one.
- Set thresholds based on your own baseline, not an industry default. A 3-minute wait might be normal for a large-format hypermarket and unacceptable for a quick-service pharmacy counter.
- Get the alert in front of whoever can actually act on it — usually the floor or duty manager, not a regional office that sees the data a week later.
- Review the weekly pattern, not just individual spikes, and use it to adjust rosters rather than just reacting in the moment every time.
- Extend to other zones once checkout is working — many retailers pair queue data with store heatmap analytics to understand whether slow checkout is pulling foot traffic away from browsing zones nearby, or whether the bottleneck is really at the entrance to the billing area itself.
Because it runs on cameras already installed for security, there's no separate hardware project to plan around — the analytics layer sits on top of the existing VMS. That's the same principle behind every VIZO361 module, whether it's queue management, footfall counting, or PPE and zone-based safety monitoring on a factory floor — the cameras are already there; the software is what makes them useful.
Frequently Asked Questions
Does queue analytics need new cameras installed at every counter?
Not necessarily. If your existing CCTV coverage already includes a reasonable view of the checkout/billing zone, the analytics can typically run on that feed. Coverage gaps (blind counters, poor angles) are usually the only reason new camera placement gets recommended, and that's assessed on a walkthrough of the actual store, not assumed upfront.
How accurate is video-based wait-time measurement compared to manual observation?
Camera-based people counting and dwell-time tracking is generally more consistent than manual spot-checks, since it measures continuously rather than sampling a few minutes here and there. Exact accuracy depends on camera angle, lighting, and queue density at a given site.
Can this work for formats other than supermarkets — like pharmacies, QSRs, or banks?
Yes. Any format with a defined queuing or waiting zone — a billing counter, a service desk, a teller line — can be instrumented the same way. The threshold and alert logic is configured per format; a bank teller line and a supermarket checkout will have very different "acceptable" wait times.
Does this replace the need for a floor manager watching the store?
No — it's meant to extend what a manager can see, not replace judgment. A manager still decides how to respond to an alert (open another counter, pull a biller from stocking, adjust for a one-off event). The system's job is making sure that decision gets made with real information and in time to matter, instead of after the queue has already cost you baskets.
How is this different from people-counting or footfall analytics?
They share the same underlying camera-based people-detection technology, but measure different things. Footfall counting tracks how many people enter a store or zone and when. Queue analytics adds dwell time and zone-specific thresholds — it's less about how many people came in, and more about how long they're stuck waiting once they're there.
Long queues are one of the most visible, most complained-about, and most fixable problems in a retail store — and one of the least measured. Book a demo - see it on your cameras and see what your checkout wait times actually look like, on the CCTV you already have.